
Summary
How do we measure how many people are in work?
We measure this through a large survey of UK households. The survey is called the Labour Force Survey (LFS). At the Office for National Statistics, we invest significant effort and resources in making make sure we interview as many people as possible, from all walks of life.
We use the Census to make sure the sample is representative of the UK population, in terms of people’s backgrounds and where they live.
In total, we interview around 90,000 people in 41,000 households every quarter. Based on this, we provide monthly estimates about how many people in the UK are in and out of work.
How many people are working?
Among the 41.3 million people of working age (16-64 years old) in the UK, around 75.5% (31.2 million) are working. 24.5% (10.1 million) are not working.
That means three in four are working and one in four are not working.
UK labour market figures |
|||
31.2 million people working(75.5% of people ages 16 to 64)
|
10.1 million people not working(24.5% of people ages 16 to 64)
|
||
| Of those:
8.4 million work less than 30 hours a week |
Of those:
24.1 million work more than 30 hours a week |
Of those:
1.4 million are looking for a job: “unemployed” |
Of those:
8.7 million are not looking for a job: “economically inactive”, e.g. studying, sickness, caring, early retirement |
Source: UK Labour Market in December 2021, figures for August to October 2021, Office for National Statistics Read more |
|||
Of the 10.1 million out of work, most (8.7 million) are not looking for work, for instance due to studying, long-term sickness, caring for family, early retirement, or for other reasons. These people are referred to as “economically inactive” in official statistics.
The other 1.4 million of the people out of work are actively looking for a job, and are referred to as “unemployed” in official statistics.
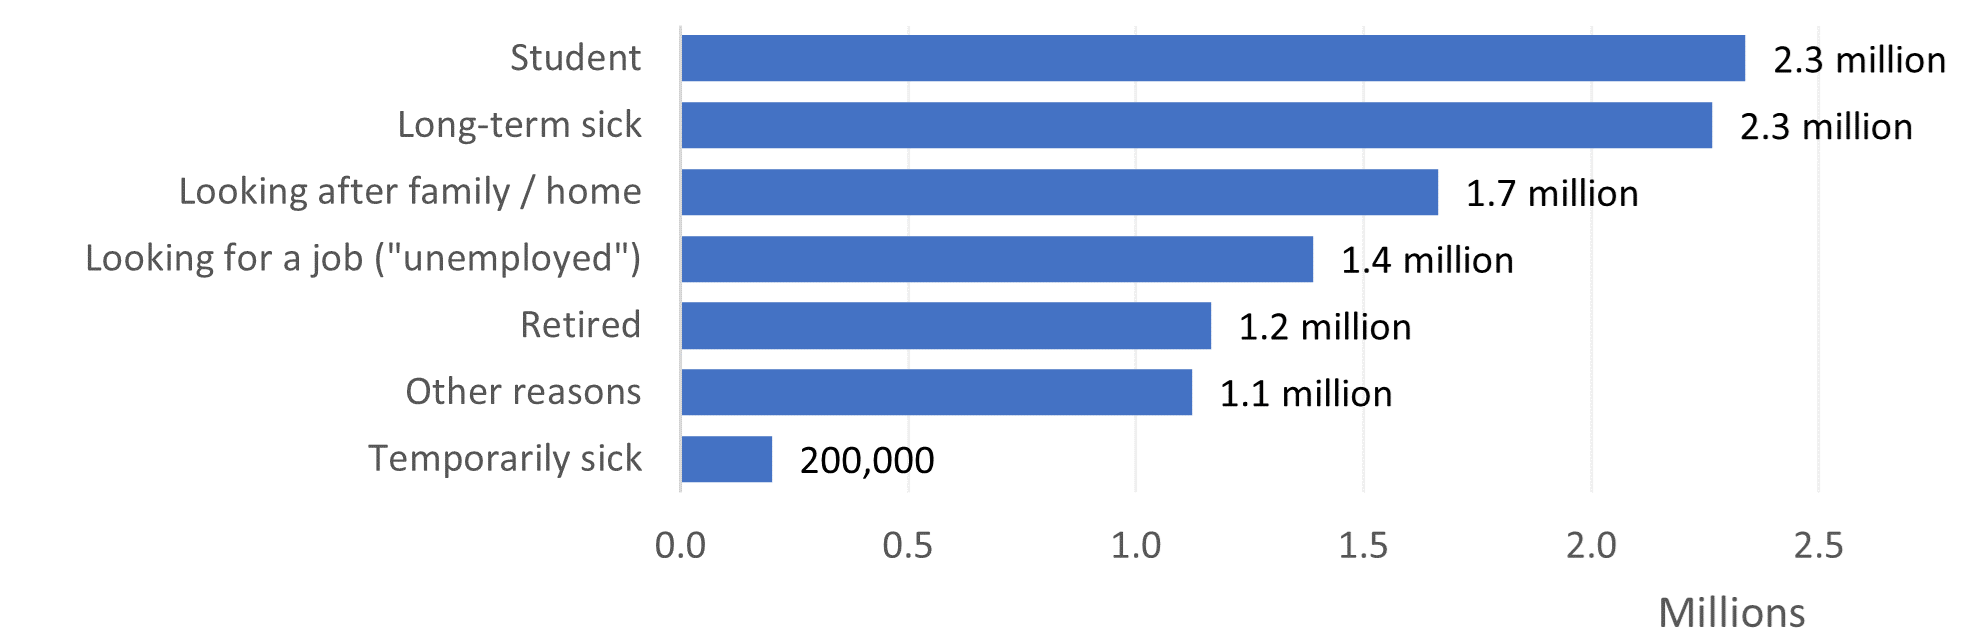
Chart 1: Reasons for unemployment
10.1 million people of working age are not currently in work. The reasons include studying, illness, caring, early retirement, and looking for a job (“unemployment”).
 Source: ONS LFS
Read more
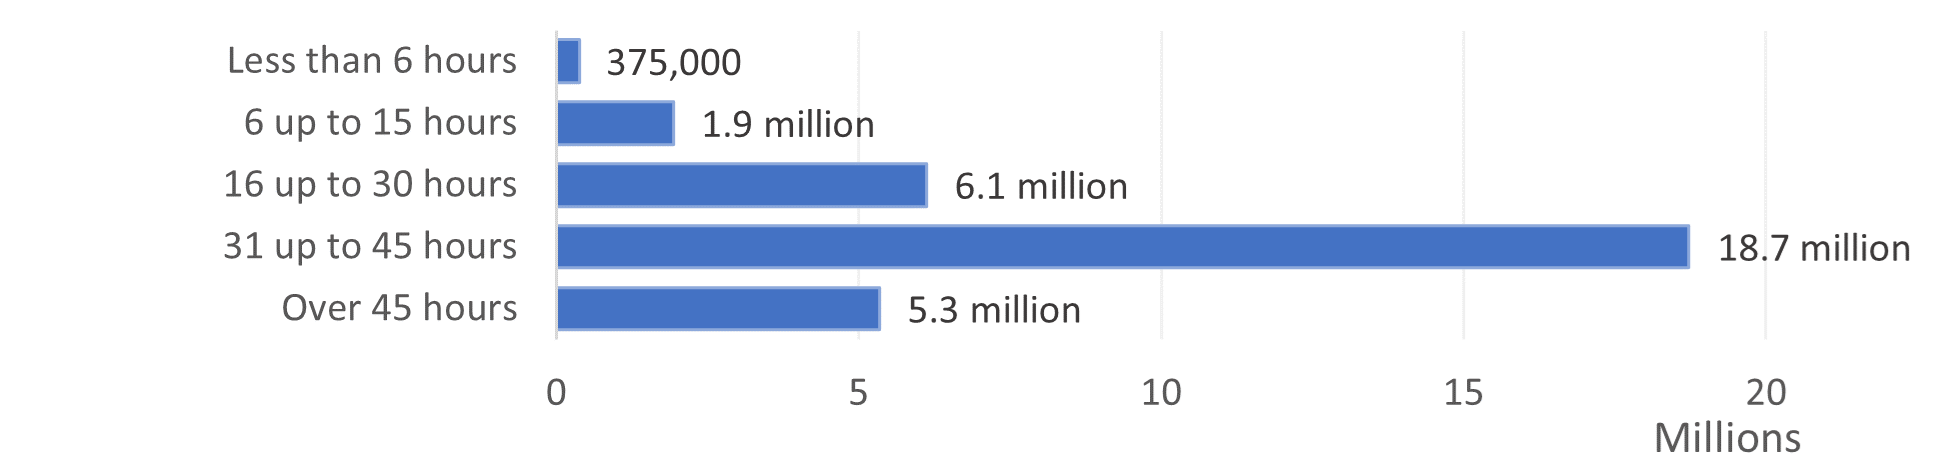
Overall, most people who are working (24.1 million) work more than 30 hours per week, while 8.4 million people work less than 30 hours per week.
Chart 2: Hours worked
Among people in work, around 24 million people work more than 30 hours per week. 8.3 million people work less than 30 hours per week.
 Source: ONS LFS
Read more
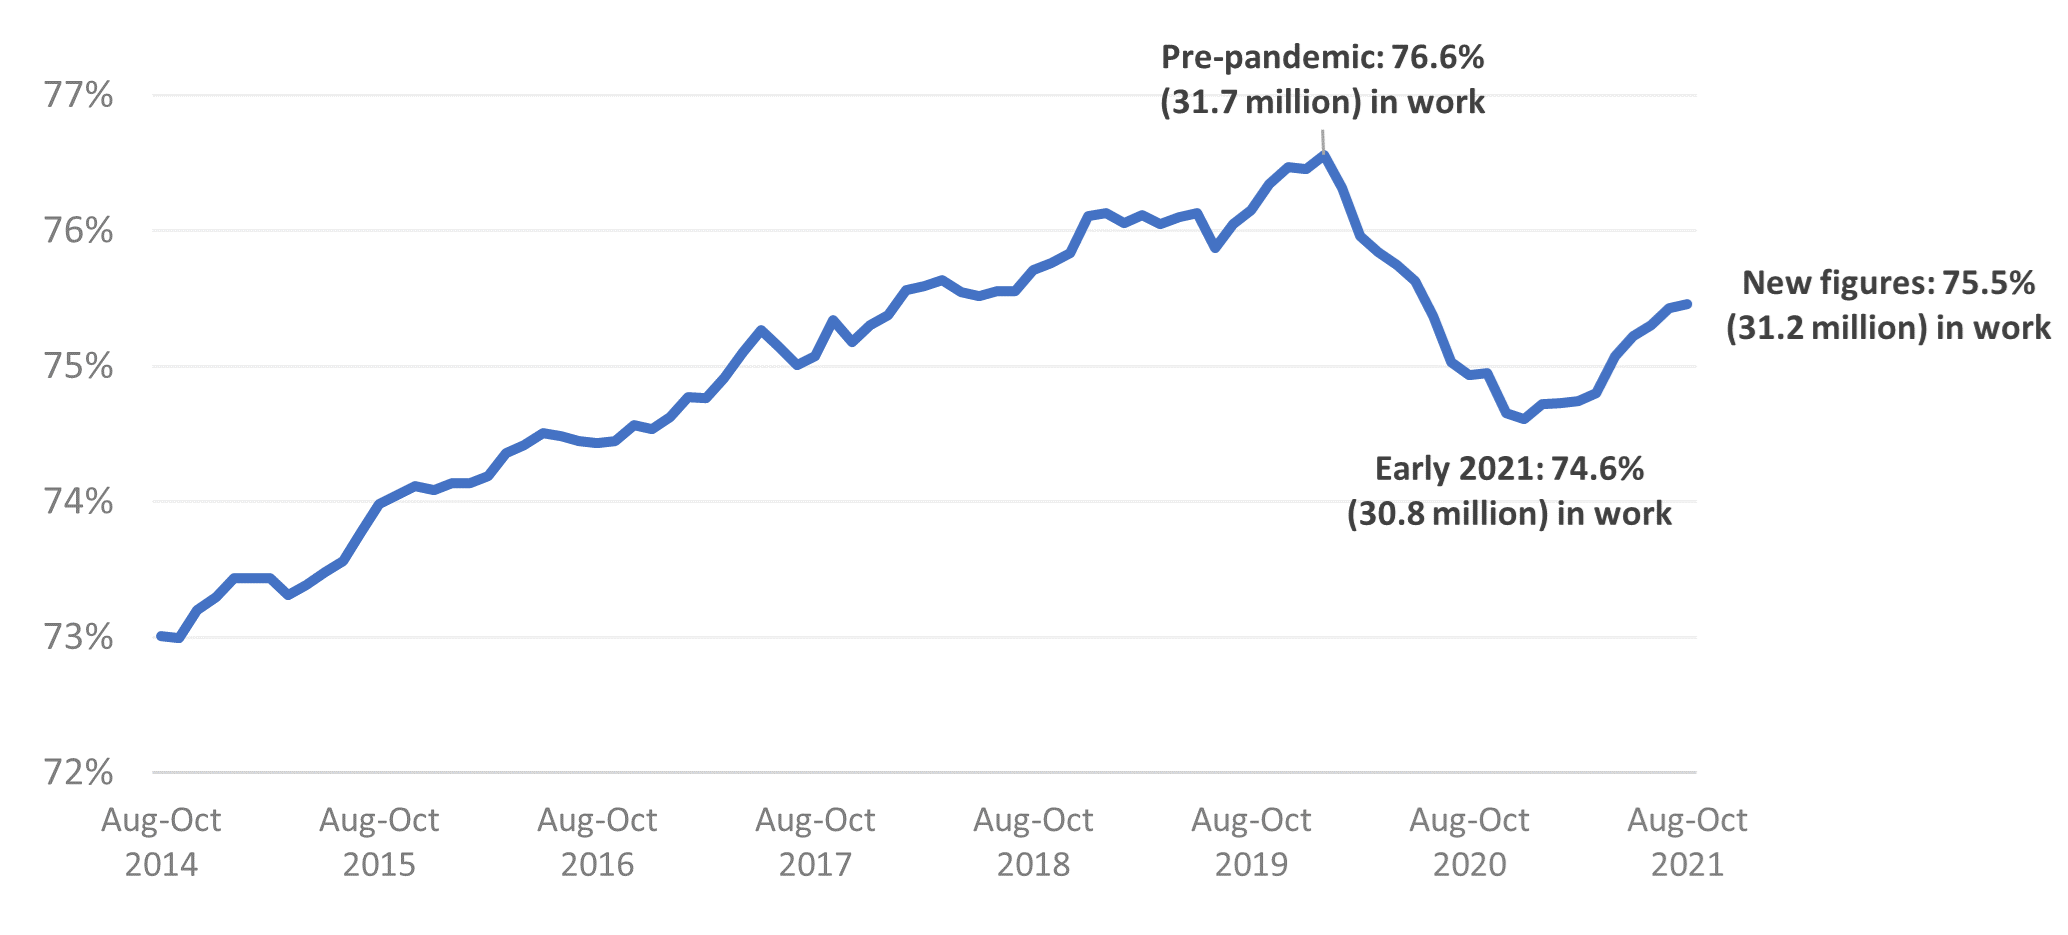
How many people are in work compared to before the pandemic?
People on furlough are counted as working. Despite this, there was a decline in the number of people in work at the beginning of the pandemic.
As Covid restrictions have been eased, people have entered back into work again.
However, today there are around 500,000 fewer people in work than before the pandemic.
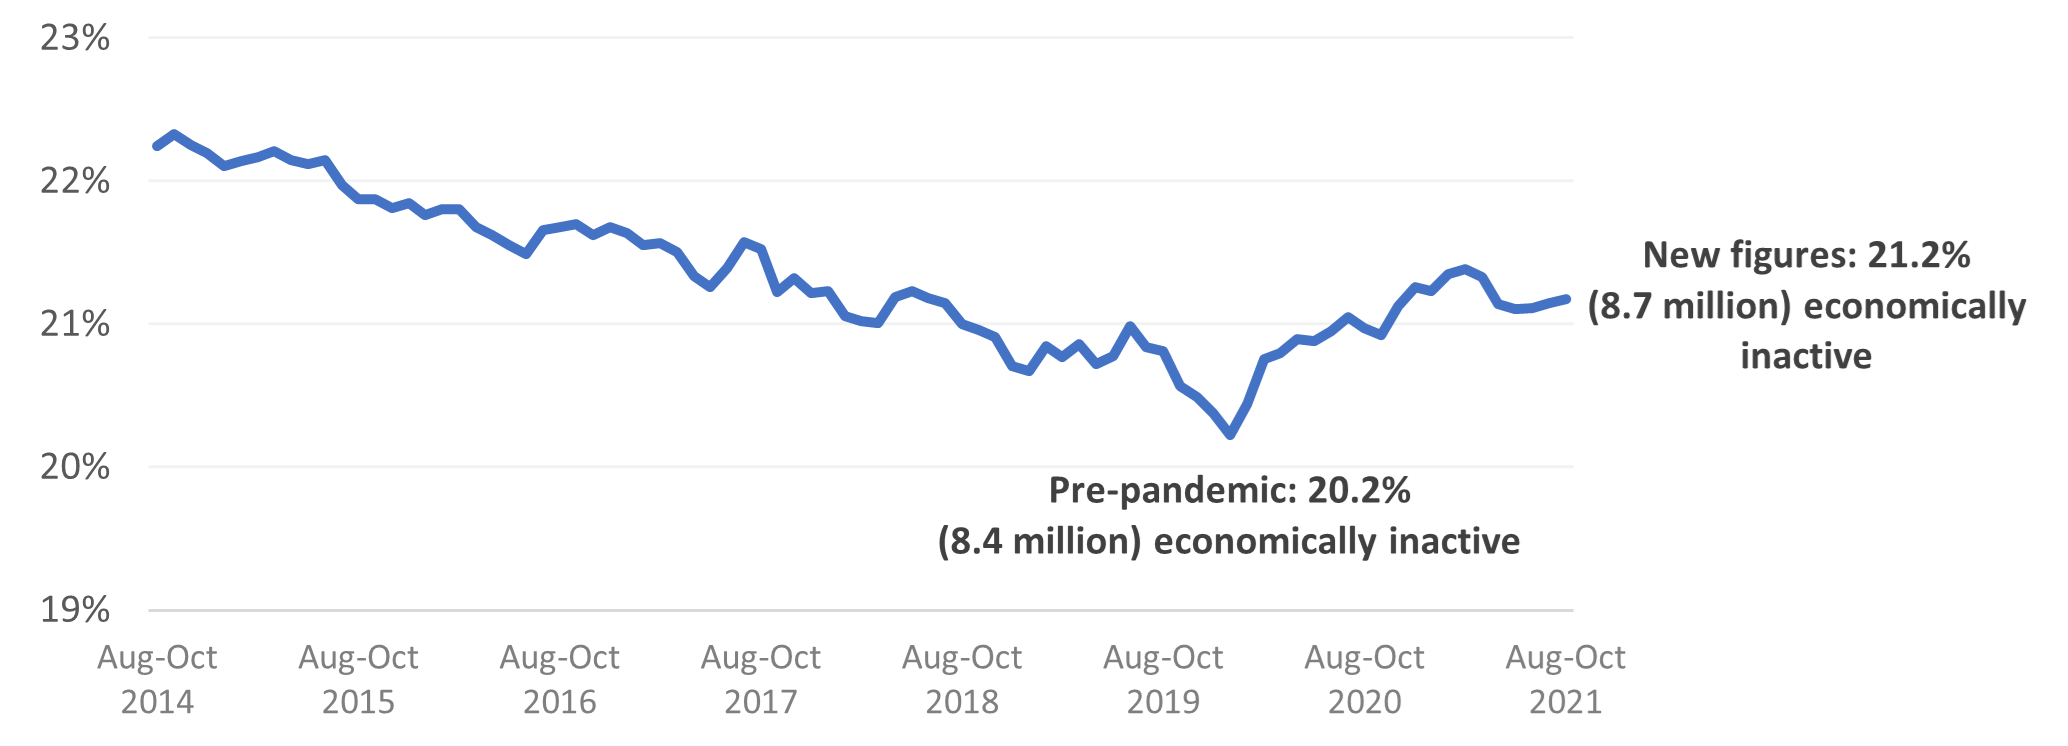
There are also 380,000 more people who are economically inactive – those out of work but not applying for jobs, for instance due to studying, long-term sickness, caring for family or early – compared to before the pandemic. In particular, there are 210,000 more students than before the pandemic.
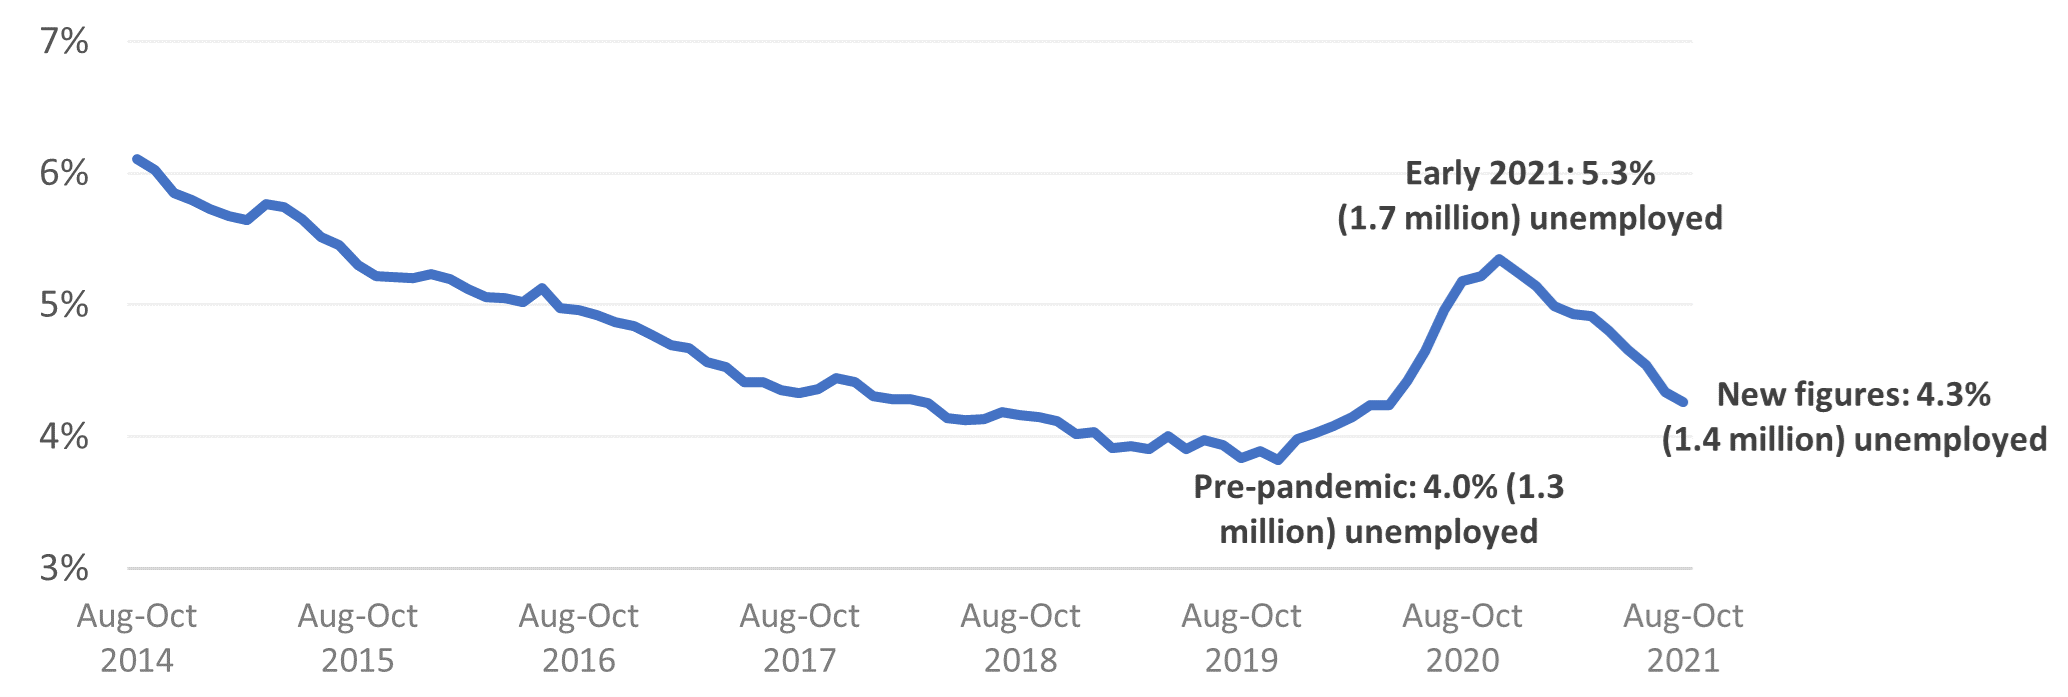
The number of unemployed people increased through the pandemic, and then fell. The unemployment rate – the number of unemployed people as a share of all the people who either have a job or are looking for one – was 4.0% before the pandemic and is now 4.3%. This is an increase of 57,000 people.
Chart 3: Employment rate (all aged 16-64)
There are 500,000 fewer people in work compared to before the pandemic.
 Source: ONS LFS
Read more
Chart 4: Economic inactivity rate (all aged 16-64)
There are 380,000 more people who are economically inactive compared to before the pandemic.
 Source: ONS LFS
Read more
Chart 5: Unemployment rate (all aged 16-64)
There are 57,000 more unemployed people compared to before the pandemic.
 Source: ONS LFS
Read more
How many job vacancies are there?
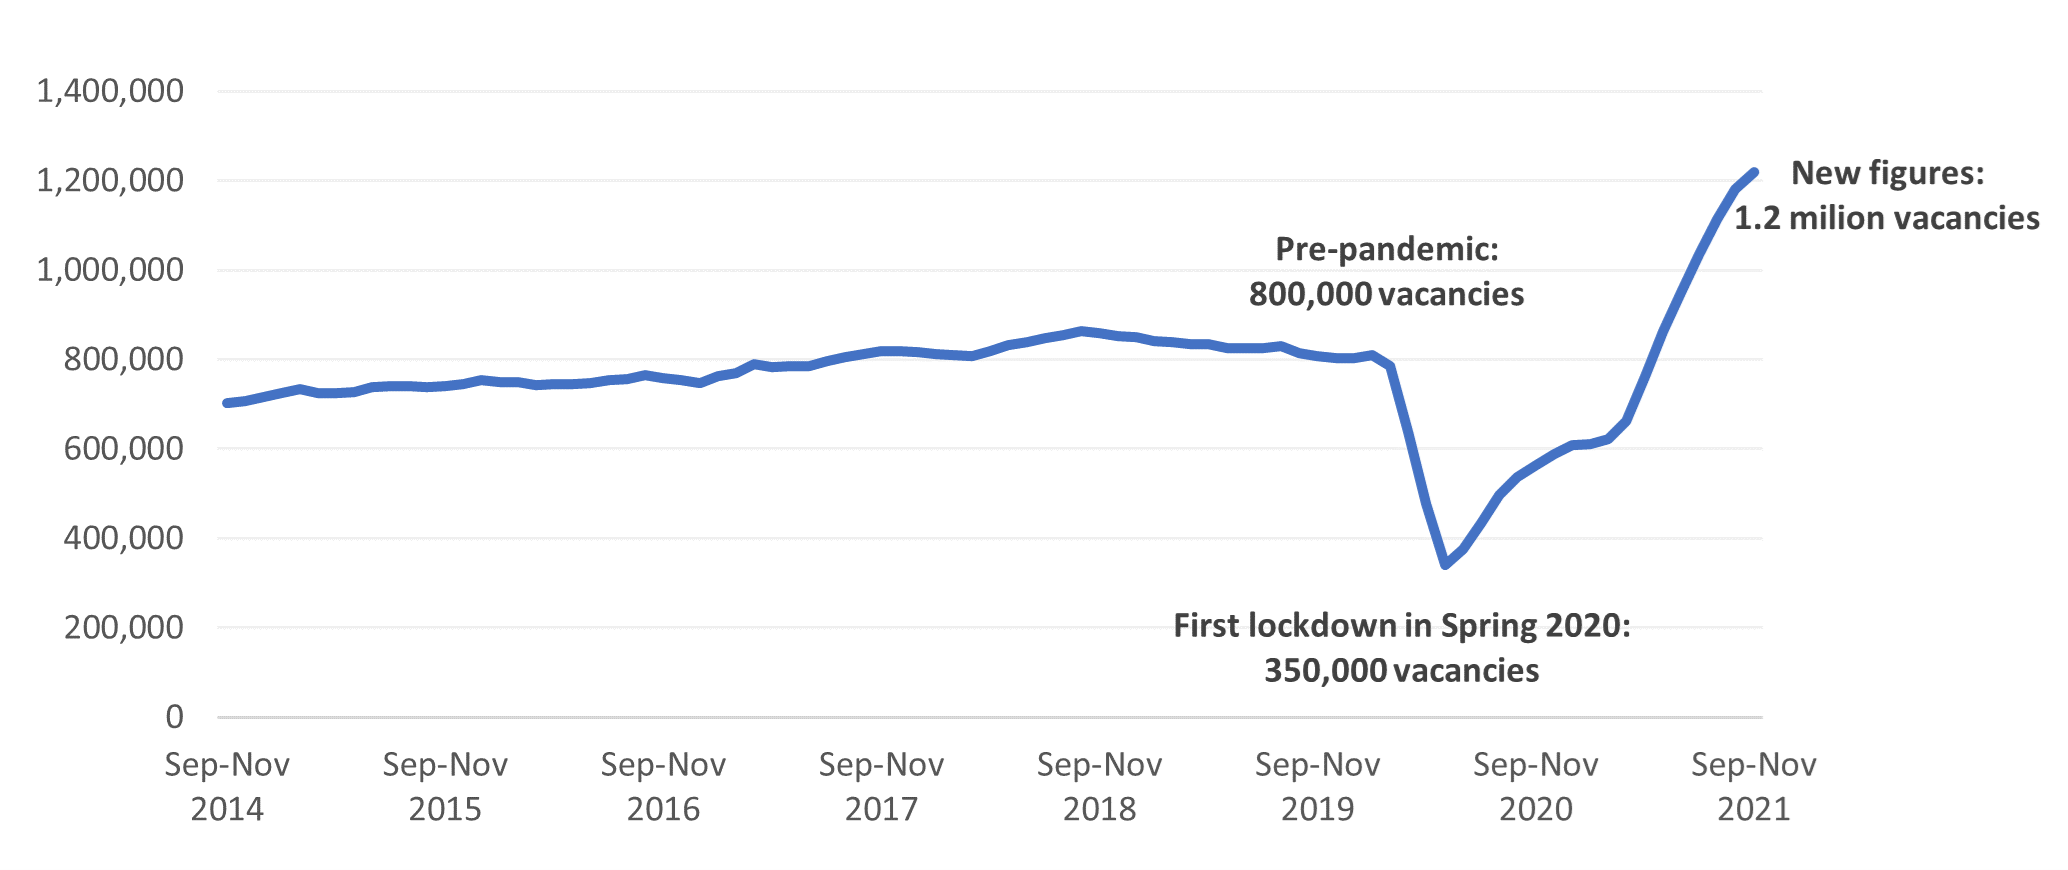
1.2 million job openings, also known as vacancies, were advertised in September to November 2021, a rise of more than 400,000 compared to before the pandemic and a record high.
All industries have at least as many jobs on offer now as before the pandemic.
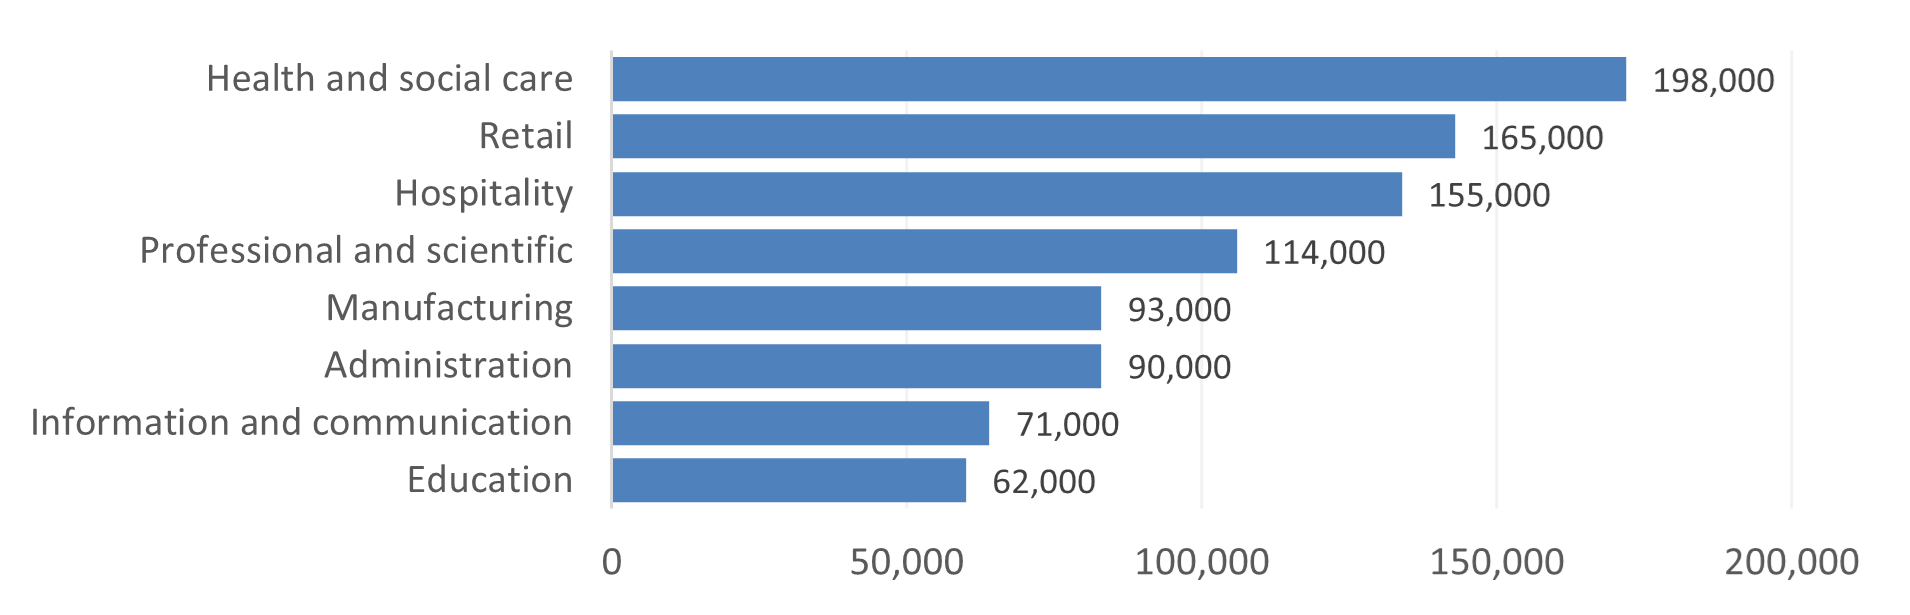
The three industries reporting the most vacancies were health and social care, hospitality, and retail and wholesale industries.
Businesses report that a lack of suitable applicants was the main reason for their difficulties in recruiting staff.
Chart 6: The number of job vacancies
The number of job vacancies has hit 1.2 million, a record high.
 Source: ONS Vacancy Survey
Read more
Chart 7: Job vacancies by industry
The three industries with the most vacancies in the three months between September to November 2021 were health and social care, hospitality, and retail and wholesale.
 Source: ONS Vacancy Survey
Read more