
Main points
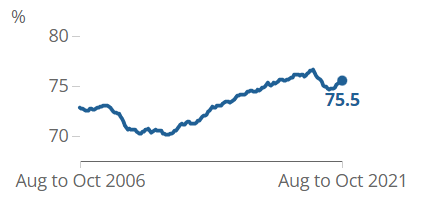
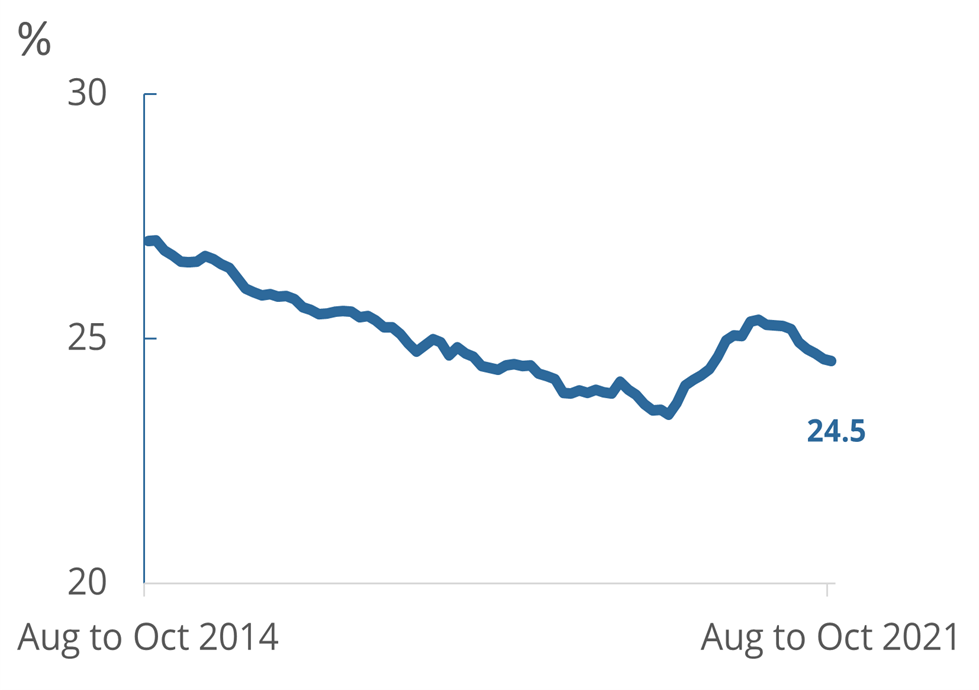
Among the 41.3 million people of working age (16-64 years old) in the UK, around 75.5% (31.2 million) are working. 24.5% (10.1 million) are not working. That means three in four are working and one in four are not working.
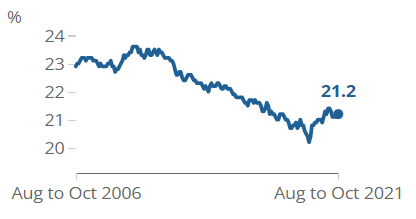
Of the 10.1 million out of work, most (8.7 million) are economically inactive. The other 1.4 million of the people out of work are unemployed. Overall, most people who are working (24.1 million) work more than 30 hours per week, while 8.4 million people work less than 30 hours per week.
People on furlough are counted as working. Despite this, there was a decline in the number of people in work at the beginning of the pandemic. As Covid restrictions have been eased, people have entered back into work again. However, today there are around 500,000 fewer people in work than before the pandemic.
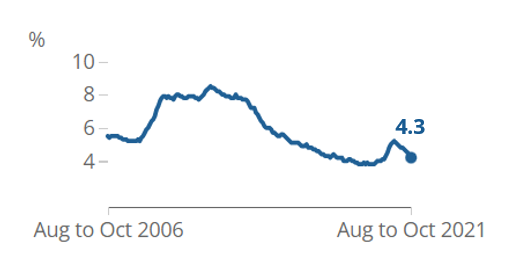
There are also 380,000 more people who are economically inactive compared to before the pandemic. In particular, there are 210,000 more students than before the pandemic. The number of unemployed people increased through the pandemic, and then fell. The unemployment rate was 4.0% before the pandemic and is now 4.3%. This is an increase of 57,000 people.
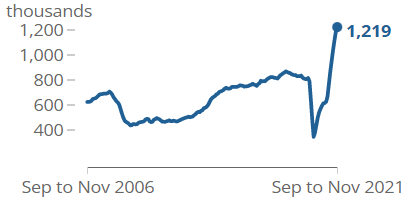
1.2 million job vacancies were advertised in September to November 2021, a rise of more than 400,000 compared to before the pandemic and a record high. All industries have at least as many jobs on offer now as before the pandemic. The three industries reporting the most vacancies were health and social care, hospitality, and retail and wholesale industries. Businesses report that a lack of suitable applicants was the main reason for their difficulties in recruiting staff.
Latest indicators at a glance
People in work (employment rate)
Rate of people in work (all aged 16 to 64)
Quarterly change: ▲0.2pps
Since Dec-Feb 2020: ▼-1.1pps
Source: ONS LFS
People out of work
Rate of people out of work (all aged 16 to 64)
Quarterly change: ▼-0.2pps
Since Dec-Feb 2020: ▲1.1pps
Source: ONS LFS
Unemployment rate
Unemployment rate (all aged 16 to 64)
Quarterly change: ▼-0.4pps
Since Dec-Feb 2020: ▲0.3pps
Source: ONS LFS
Inactivity rate
Economic inactivity rate (all aged 16 to 64)
Quarterly change: ▲0.1pps
Since Dec-Feb 2020: ▲1.0pps
Source: ONS LFS
Job vacancies
Number of job vacancies
Quarterly change: ▲184,700
Since Jan-Mar 2020: ▲434,500
Vacancies increased on the quarter and continue to be at record levels
Source: ONS LFS
Glossary
Economic inactivity
Economic inactivity measures people not working and not looking for work. The economic inactivity rate is the share of people who are economically inactive, out of all people aged 16-64.
People in work (employment)
Employment measures people working or who had a job they were temporarily away from. The employment rate is the proportion of people aged between 16 and 64 years who are in employment. A more detailed explanation is available in A guide to labour market statistics.
Unemployment
Unemployment measures people without a job who have been actively seeking work within the last four weeks and are available to start work within the next two weeks. The unemployment rate is not the proportion of the total population who are unemployed. It is the proportion of the economically active population (those in work plus those seeking and available to work) who are unemployed.
Vacancies
Vacancies are positions for which employers are actively seeking recruits from outside their business or organisation.
A more detailed glossary is available.